
Puerto Vallarta Weather by Month
Twelve months of Puerto Vallarta, Mexico weather — averages from 2006–2025.
Puerto Vallarta's warmest month is July (average high 30.8°C (87.4°F)) and the coolest is January (27.3°C (81.1°F)). The most rain falls in August (about 305 mm), and April is the driest (about 1 mm). April is the sunniest, with about 11.8 hours of sunshine a day.
Best months to visit Puerto Vallarta
Ranked within Puerto Vallarta's own year by temperature comfort, rainy days and sunshine — historical averages, not a forecast.
Puerto Vallarta month by month
January
GreatHigh 27.3°C (81.1°F)
Low 18.1°C (64.6°F)
- Rainfall
- 16 mm (0.6 in)
- Rainy days
- 2 rainy days
- Sunshine
- 9.8 h sunshine / day
February
GreatHigh 27.4°C (81.3°F)
Low 17.7°C (63.9°F)
- Rainfall
- 24 mm (1 in)
- Rainy days
- 2 rainy days
- Sunshine
- 10.5 h sunshine / day
March
GreatHigh 28.1°C (82.6°F)
Low 17.6°C (63.7°F)
- Rainfall
- 11 mm (0.4 in)
- Rainy days
- 1 rainy days
- Sunshine
- 11.5 h sunshine / day
April
GreatHigh 29.1°C (84.4°F)
Low 18.7°C (65.7°F)
- Rainfall
- 1 mm (0 in)
- Rainy days
- 0 rainy days
- Sunshine
- 11.8 h sunshine / day
May
GreatHigh 30.7°C (87.3°F)
Low 21.1°C (70°F)
- Rainfall
- 16 mm (0.6 in)
- Rainy days
- 3 rainy days
- Sunshine
- 11.8 h sunshine / day
June
FairHigh 30.6°C (87.1°F)
Low 23.9°C (75°F)
- Rainfall
- 155 mm (6.1 in)
- Rainy days
- 16 rainy days
- Sunshine
- 10 h sunshine / day
July
FairHigh 30.8°C (87.4°F)
Low 24.5°C (76.1°F)
- Rainfall
- 257 mm (10.1 in)
- Rainy days
- 25 rainy days
- Sunshine
- 9.2 h sunshine / day
August
FairHigh 30.8°C (87.4°F)
Low 24.6°C (76.3°F)
- Rainfall
- 305 mm (12 in)
- Rainy days
- 28 rainy days
- Sunshine
- 8.8 h sunshine / day
September
FairHigh 30.4°C (86.7°F)
Low 24.4°C (75.9°F)
- Rainfall
- 284 mm (11.2 in)
- Rainy days
- 26 rainy days
- Sunshine
- 8.5 h sunshine / day
October
FairHigh 30.4°C (86.7°F)
Low 23.9°C (75°F)
- Rainfall
- 138 mm (5.4 in)
- Rainy days
- 18 rainy days
- Sunshine
- 9.8 h sunshine / day
November
GreatHigh 29.5°C (85.1°F)
Low 21.5°C (70.7°F)
- Rainfall
- 28 mm (1.1 in)
- Rainy days
- 4 rainy days
- Sunshine
- 10.2 h sunshine / day
December
GreatHigh 27.8°C (82°F)
Low 19.3°C (66.7°F)
- Rainfall
- 27 mm (1.1 in)
- Rainy days
- 3 rainy days
- Sunshine
- 9.6 h sunshine / day
Puerto Vallarta Climate & Weather Guide
Temperature, rainfall and sunshine through the year — 2006–2025 averages.
30.8°C (87.4°F)
Hottest month avg high
27.3°C (81.1°F)
Coolest month avg high
305mm
Wettest month avg
1mm
Driest month avg
Temperature by Month
Rainfall by Month
Sunshine Hours
Monthly Averages
| Month | Avg High | Avg Low | Rainfall | Rainy Days | Sunshine |
|---|---|---|---|---|---|
| Jan | 27.3°C (81.1°F) | 18.1°C (64.6°F) | 15.6mm | 2 | 9.8h |
| Feb | 27.4°C (81.3°F) | 17.7°C (63.9°F) | 24.4mm | 2 | 10.5h |
| Mar | 28.1°C (82.6°F) | 17.6°C (63.7°F) | 11.3mm | 1 | 11.5h |
| Apr | 29.1°C (84.4°F) | 18.7°C (65.7°F) | 1mm | 0 | 11.8h |
| May | 30.7°C (87.3°F) | 21.1°C (70°F) | 16mm | 3 | 11.8h |
| Jun | 30.6°C (87.1°F) | 23.9°C (75°F) | 154.9mm | 16 | 10h |
What to Pack
Suggested packing for Puerto Vallarta's climate.
Versatile Layers
Light layers that work for both mild afternoons and cooler evenings.
Rain Protection
A compact umbrella and a light rain jacket for the wettest months.
Sun Protection
Sunscreen, a wide-brimmed hat and sunglasses for hot, sunny days.
More Mexico cities by month
Related articles
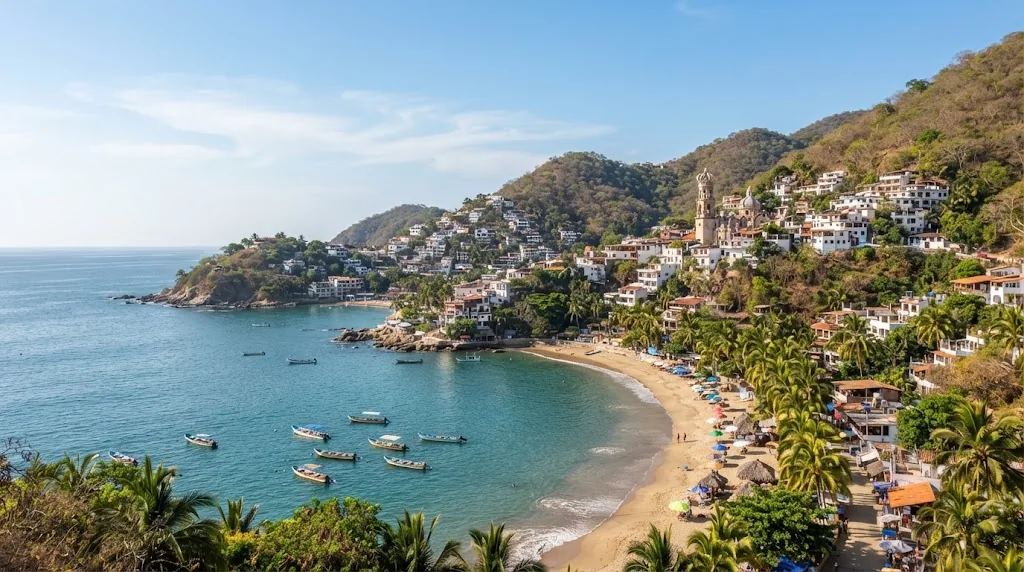
Best Time to Visit Puerto Vallarta: Dry Season, Whales and Rainy Months
The best time to visit Puerto Vallarta is November to May, with March and April the driest months and up to 11.8 hours of sun. August is the wettest month at 12.0 inches of rain.
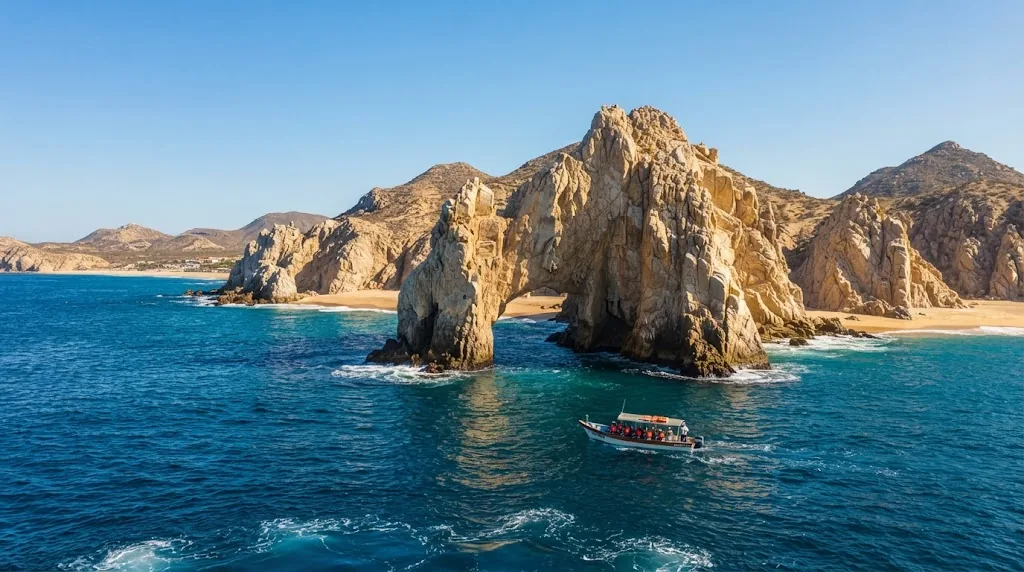
Best Time to Visit Cabo San Lucas: Weather, Whales and Months to Skip
The best time to visit Cabo San Lucas is November to April, with almost no rain and highs of 77F to 84F (25C to 29C). September is the wettest and stormiest month at 4.3 inches.
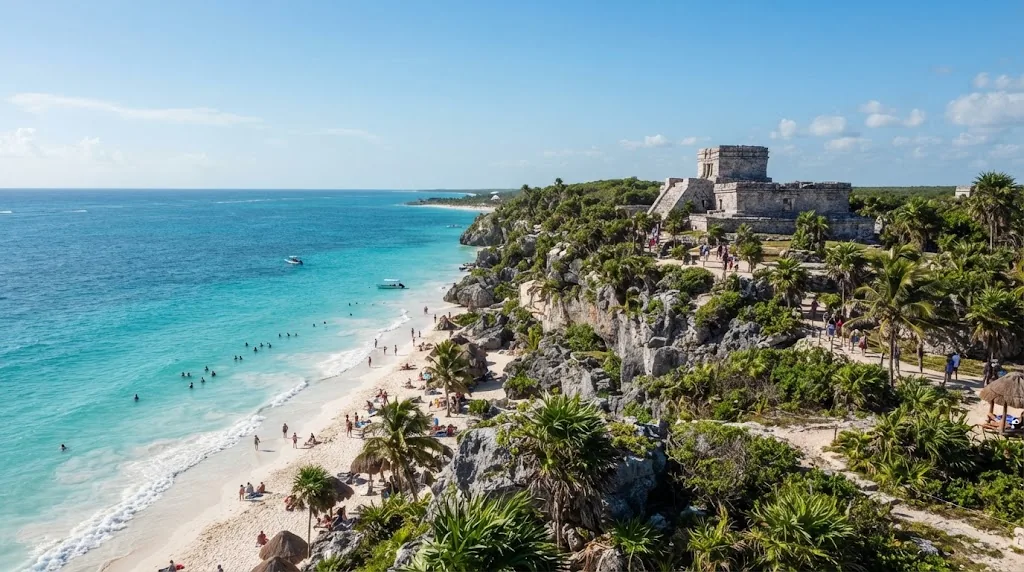
Best Time to Visit Tulum: Month by Month Weather and Seaweed Season
The best time to visit Tulum is February to April, with only 1.4 to 1.6 inches of rain a month and up to 11.8 hours of sun. September and October are the wettest months at about 7.2 inches.
Planning a trip to Puerto Vallarta?
Get a day-by-day weather plan for your exact travel dates.
Use our Trip PlannerBased on 20 years of historical weather data (2006–2025) from Open-Meteo. Monthly averages, not a forecast.